
You've acquired a new player at an acceptable CPA. They've registered, deposited, and perhaps even placed a first bet, so the dashboard looks healthy. Then the first withdrawal triggers extra verification, the player's card payment fails, support takes too long to resolve the issue, and the account disappears from your active base. The acquisition report still counts a conversion. Your P&L tells a different story.
That gap is where player lifetime value earns its place. It's not a decorative forecast for finance. It's the operating measure that connects acquisition cost, bonus exposure, payment friction, KYC, support, responsible gaming, and retention to the net contribution a player creates over time. Operators that manage those moments well can make better decisions about which channels deserve budget and which cohorts need intervention.
Table of Contents
- Why Player Lifetime Value Matters More Than Acquisition Volume
- Defining Player Lifetime Value the Way Operators Actually Use It
- Cohort, Predictive, and Segment-Level Modeling Approaches
- Data Inputs That Make or Break an LTV Model
- From LTV to Acquisition and Retention Budgeting
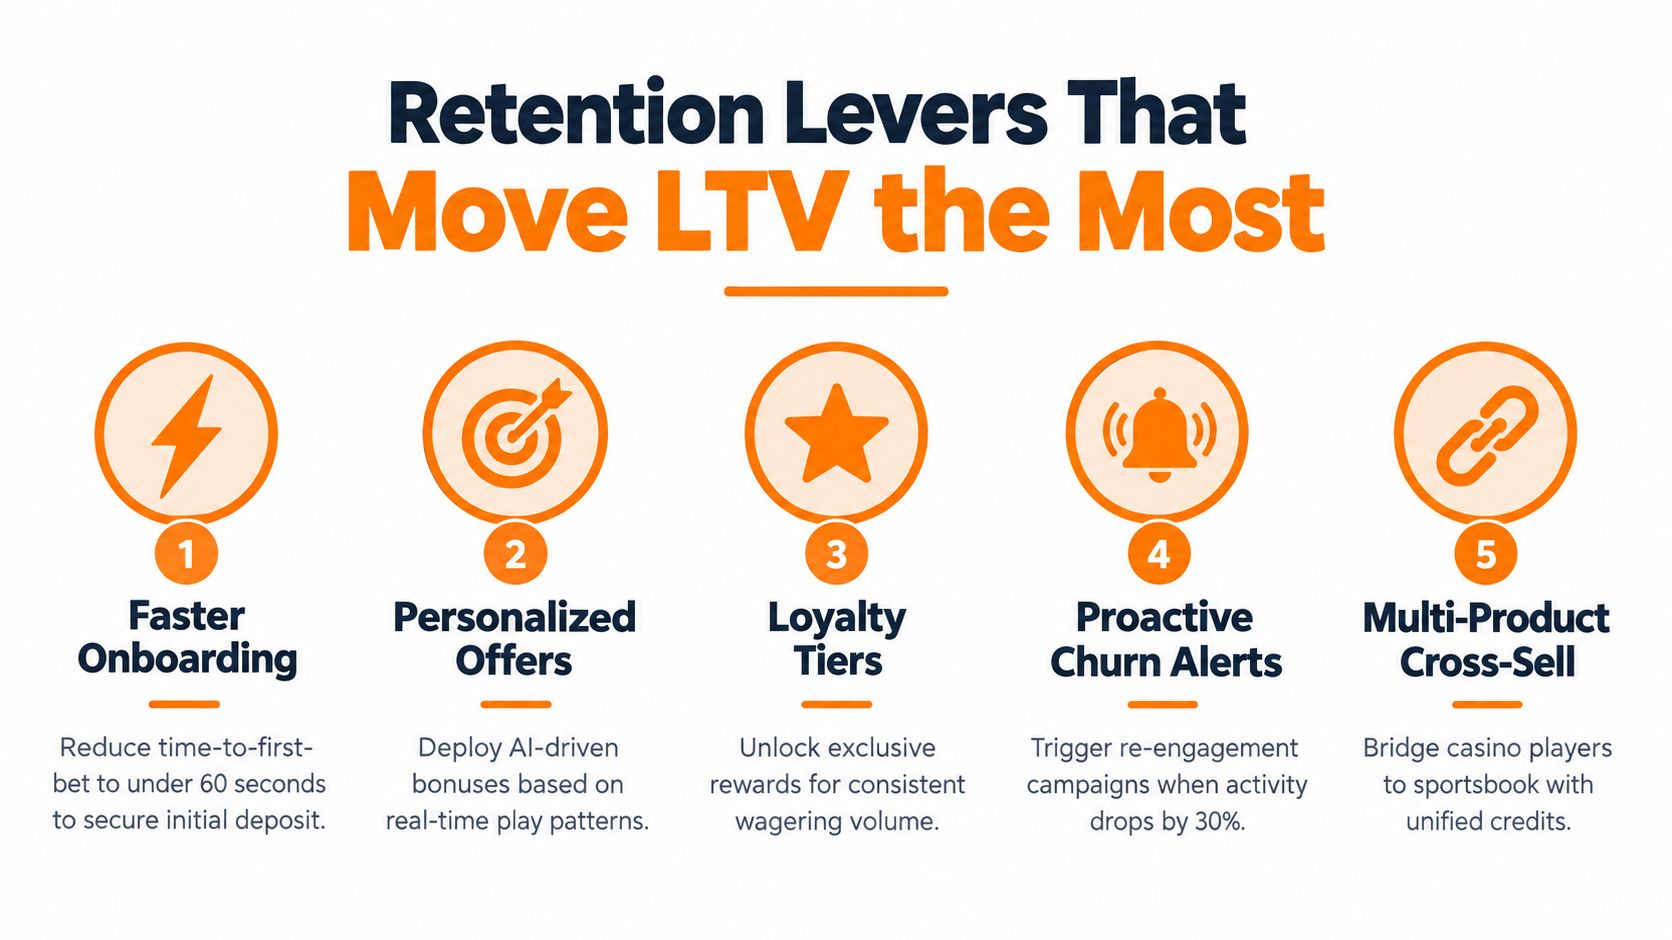
- Retention Levers That Move LTV the Most
- Reporting LTV on a Unified Casino and Sportsbook Back-Office
- Building an LTV Practice Operators Can Actually Defend
Why Player Lifetime Value Matters More Than Acquisition Volume
Consider two players acquired through the same affiliate on the same Monday. Both deposit €40, both look similar in the CRM for the first couple of weeks, and both cost the operator roughly the same to acquire. One continues wagering, completes verification, and withdraws €180 over the following six months. The other retries KYC, encounters a declined card, waits for support, and stops returning.
The registration report sees two deposits. The commercial reality is two very different outcomes. One player generates a viable contribution tail. The other may never recover acquisition, payment, bonus, compliance, and support costs.
That's why acquisition volume can flatter an operator. Signups and first deposits describe the start of the relationship, not its economics. LTV forces the business to ask whether a channel attracts players who remain active long enough to repay CAC and operating friction.
The metric that disciplines channel decisions
An operator can use player lifetime value to set practical boundaries for:
- Paid acquisition, by comparing cohort contribution with the cost of each campaign and market.
- Affiliate terms, by determining whether CPA or revenue-share arrangements fit the cohort's net value. The economics of affiliate structures are discussed in this iGaming affiliate program guide.
- Bonus design, by measuring effective promotional cost rather than treating every offer as an equivalent acquisition incentive.
- Retention investment, by identifying which player states justify CRM, loyalty, or service intervention.
The most valuable insight often appears outside gameplay. A smooth onboarding flow can preserve momentum. A clear first KYC request can prevent abandonment. A fast and predictable withdrawal can protect trust. A safer-gambling intervention can keep a player in a regulated relationship rather than allowing unmanaged risk to become a compliance or churn event.
Practical rule: Don't approve the next acquisition budget from registrations alone. Review what each cohort contributes after bonuses, payments, verification, support, and withdrawals.
A channel that produces fewer players but stronger net contribution can be more valuable than a high-volume source with rapid churn. The operator's job is to identify that difference before the next budget cycle, not after the cohort has already become unprofitable.
Defining Player Lifetime Value the Way Operators Actually Use It
Player lifetime value is the total net contribution a player is expected to generate over a defined relationship or measurement horizon. In iGaming, that contribution should be based on net gaming revenue or contribution margin, not just gross deposits or turnover. A useful neutral explanation of the concept is provided in this lifetime value glossary.
The simple starting point is:
LTV = value per active period × expected active lifetime
If a player produces £30 of net gaming revenue per active month and monthly churn is about 10%, the implied average active lifespan is 10 months, producing an approximate LTV of £300 before discounting, as illustrated by the glossary above. The calculation is useful because it makes the retention relationship visible. If the player remains active for longer while monthly value stays stable, cumulative contribution rises.
That basic formula is not enough for operating decisions. A credible model deducts the costs that sit between gross revenue and contribution:
- Bonus cost, including free bets, free spins, and converted wagering incentives.
- Payment processing fees and failed-payment costs.
- Chargebacks and reversals.
- Customer service and account-management effort.
- KYC, verification, and compliance processing.
- Applicable taxes or other market-specific deductions.
Use horizons instead of pretending the tail is known
Full-lifetime forecasts become fragile when a cohort is young or behavior changes quickly. Operators therefore benefit from fixed-horizon reporting, such as 30, 90, and 180 days, with longer horizons used for product and lifecycle planning. Shorter windows help acquisition teams set bids and affiliate terms. Longer windows help product, payments, and CRM teams judge whether a retention change is durable.
The practical calculation looks like this:
Horizon LTV = cumulative net contribution from the cohort by the chosen day
That definition keeps the model accountable. A 30-day result is an actual observation, while a projected lifetime tail is an assumption that should be labeled and recalibrated.
Why retention deserves the first test
The relationship between churn and lifetime makes retention unusually powerful. Extending an active relationship by a few months can add contribution without requiring another acquisition event, another affiliate payment, or another onboarding sequence. By contrast, doubling media spend at the same CPA increases volume but doesn't improve the economics of the players already acquired.
Don't use an unsupported lift assumption to justify a retention project. Set a baseline, define the intervention, hold out a comparable group, and measure the net contribution difference at the selected horizon. The model should record the observed result, not the result the team hoped to see.
Cohort, Predictive, and Segment-Level Modeling Approaches
No single LTV method answers every commercial question. A simple formula is easy to explain, a cohort model is grounded in observed behavior, and a predictive model helps estimate what immature players may do next. The mistake is using one of them as a universal truth.
| Approach | Inputs Required | Best Used For | Key Limitation |
|---|---|---|---|
| Simple formula | Average value per period, churn, expected lifetime | Board-level sanity checks and quick scenario work | Hides retention shape and player variation |
| Cohort LTV | Signup or first-deposit date, channel, jurisdiction, deposits, net contribution, activity by horizon | Media buying, CAC payback, affiliate commission setting | Young cohorts may look weak or strong before they mature |
| Predictive model | Behavioral events, recency, frequency, monetary value, churn labels, cohort history | CRM sequencing, bonus decisions, product planning, residual-tail forecasts | Sensitive to data quality, drift, and modeling assumptions |
| Segment contribution | Cohort, source, jurisdiction, device, product, KYC, bonus, and behavior attributes | Honest unit economics and operational prioritization | Requires consistent identity and cost allocation |
Cohort LTV is the commercial workhorse
A cohort groups players by a meaningful starting event, usually registration or first deposit, then follows cumulative contribution over time. Splitting the view by acquisition source, jurisdiction, product, or bonus exposure shows whether a channel is improving or just buying more low-value volume.
For a weekly acquisition review, cohort LTV is usually the right control variable. It reflects actual money rather than a forecast and can be compared directly with CAC, commission, and promotional cost.
Predictive models are useful when the evidence is incomplete
Approaches such as BG/NBD, Pareto/NBD, and regression-based churn scoring can estimate a residual tail for cohorts that haven't reached a mature horizon. They're particularly useful for prioritizing CRM actions, identifying likely reactivation candidates, or simulating the impact of a product change.
They shouldn't replace observed cohort reporting. A model can rank players effectively while still overstating the eventual contribution of a market, payment method, or promotional segment if the underlying training data is biased.
Segment-level contribution prevents false averages
Revenue is often concentrated. A peer-reviewed video-game study summarized in this arXiv paper states that up to 50% of revenue can come from roughly 2% of players. The same source also reports that more than half of costly acquired players stop being active on the day of install, while 75.4% of Android players churn by day 30. Those findings reinforce why averages can conceal both high-value cohorts and rapidly decaying ones.
Use simple formulas for orientation, cohorts for budget control, predictions for prioritization, and segments for accountability. Review each against the others instead of allowing a polished forecast to overrule actual net contribution.
Data Inputs That Make or Break an LTV Model
An LTV model is only as honest as the events feeding it. The first requirement is a stable player identity that connects registration, first deposit, wagers, casino play, withdrawals, KYC decisions, support contacts, bonuses, and responsible-gaming actions across the same account.
Start with the commercial spine:
- First-deposit timestamp: Establishes cohort membership and measurement age.
- Deposit count and value: Separates one-time funders from repeat funders.
- Payment method: Shows whether cards, wallets, bank methods, or other rails carry different costs and failure patterns.
- Casino and sportsbook activity: Prevents cross-product value from being split across disconnected records.
- Net gaming revenue: Captures the value left after relevant promotional deductions rather than relying on gross turnover.
Bonus data needs more than an issued amount. A €20 bonus that costs €18 after wagering and conversion has a very different effect from a €20 offer that costs €4. Record issuance, wagering progress, conversion, expiry, cancellation, and the resulting net cost.
Operational events belong in the same model
KYC outcomes, verification retries, deposit failures, withdrawal requests, withdrawal completion time, chargebacks, reversals, and support contacts can explain why a cohort's value changes. A player who reaches a first withdrawal and encounters repeated friction is not equivalent to a player who completes the same journey smoothly.
Data gaps create silent errors. A sportsbook bet written to a separate ledger, a missing deposit identifier, or a duplicate player created during migration can make revenue appear lower, costs appear disconnected, or a player look like two different people. Reconciliation should happen before modeling, not after a forecast has already shaped a budget.
A useful model therefore stores both value and state. It should tell the team not only what a player contributed, but whether that player is onboarding, awaiting KYC, payment-blocked, withdrawing, support-contacted, reactivated, or subject to a safer-gambling review.
From LTV to Acquisition and Retention Budgeting
LTV earns its place in the operating plan when it sets a spending limit. Suppose a 30-day cohort produces €95 of LTV and the business operates at a 35% gross margin. That produces roughly €33 of contribution per player. The example is a budgeting illustration, not a universal benchmark, but it shows how revenue becomes an acquisition ceiling.
With a four-month payback target, dividing €33 across four months gives roughly €8 of allowable monthly spend before the unit economics turn negative. The ceiling changes with the contribution definition, tax, bonus cost, payment expense, and whether the €95 already includes those deductions. Record each assumption so finance, marketing, and product teams are working from the same calculation.
| LTV input | Worked value | Budget ceiling it sets | Watch for it |
|---|---|---|---|
| 30-day cohort LTV | €95 | Starting value for payback modeling | Don't confuse revenue with contribution |
| Gross margin | 35% | Approximately €33 contribution in this example | Margin can change by product and market |
| Payback target | Four months | Approximately €8 per month of allowable spend | A short horizon can understate the tail |
| Acquisition cost | Compared with contribution | CAC and affiliate cap | Review by channel, not as a blended average |
CAC and affiliate terms need the same denominator
Paid media teams may optimize toward projected return, while affiliate teams negotiate CPA or revenue share. Budget both against the same net cohort contribution. Set a per-channel CAC ceiling from the €33 contribution figure, then cap affiliate CPA at that ceiling. Review the cap monthly against realized cohort contribution, with separate limits where product mix, market costs, or player quality differ. Affiliate program economics should be evaluated through this budgeting lens, rather than through a fixed rate applied across every jurisdiction and product.
Retention budgets need a different comparison. A one-and-done signup should not receive the same reactivation allocation as a player who continues depositing through later activity periods. Assess the reactivatable LTV remaining in each segment, estimate what an intervention can recover, and approve the message, offer, service work, or product change only when expected contribution exceeds its cost.
Bonus budgets follow the same discipline. Cap effective bonus cost against expected contribution by cohort and segment instead of assigning a uniform euro amount to every player. A flat cap can over-incentivize low-value players while under-serving higher-value players whose retention depends on more considered, compliant treatment.
Budget test: Every acquisition, affiliate, bonus, and retention line should be expressible as a fraction of modeled net contribution. Recheck that fraction as cohorts mature, because early LTV can make a channel appear affordable before its later costs and value are visible.
Retention Levers That Move LTV the Most
Acquisition creates the relationship. Operational execution determines whether the relationship survives. The highest-value work often happens in ordinary moments that a marketing dashboard doesn't classify as campaigns: the first deposit, the first verification request, the first failed payment, the first withdrawal, and the first sign that activity is becoming risky or inconsistent.
Fix the moments players interpret as a broken promise
Onboarding should move a new player from registration to a clear, compliant first action without unnecessary uncertainty. Explain KYC requirements before they become a withdrawal surprise, show payment failures with a useful recovery path, and make the next step obvious.
Payments deserve priority because a failed first deposit can end the relationship before a bonus has any opportunity to help. Review decline reasons by method, route players toward legitimate alternatives, and keep withdrawal status visible instead of forcing repeated support contacts.
Loyalty works when it recognizes sustained, profitable behavior rather than handing out a headline offer to everyone. Segmentation, tier rules, and non-sticky structures can support retention, but every incentive needs a net contribution test. NexGrate describes gaming loyalty program workflows that connect tiers, segmentation, bonuses, and campaign analytics with player-value management.
Support is part of the LTV model. Track the relationship between contact reason, resolution time, repeat contact, and later activity. A named human host may be appropriate for a high-value player, while routine payment or account questions can follow a well-designed automated path.
Treat safer gambling as a relationship safeguard
Affordability checks, deposit limits, cooling-off tools, and safer-gambling messaging aren't merely compliance outputs. They change the relationship's shape and can prevent unmanaged play, payment distress, chargebacks, and abrupt account failure. The operator shouldn't optimize for the longest possible lifetime at any cost. The target is a sustainable, regulated relationship with positive net contribution and appropriate player protection.
Run each intervention as a controlled hypothesis. Define the eligible segment, the expected behavioral signal, the financial outcome, and a holdout group. Feed the observed change back into the horizon LTV model instead of carrying an assumed uplift forward indefinitely.
The retention work described above is operational, not cosmetic. It requires shared data, clear ownership, and a back office that lets payments, CRM, compliance, and acquisition teams see the same player state.
Reporting LTV on a Unified Casino and Sportsbook Back-Office
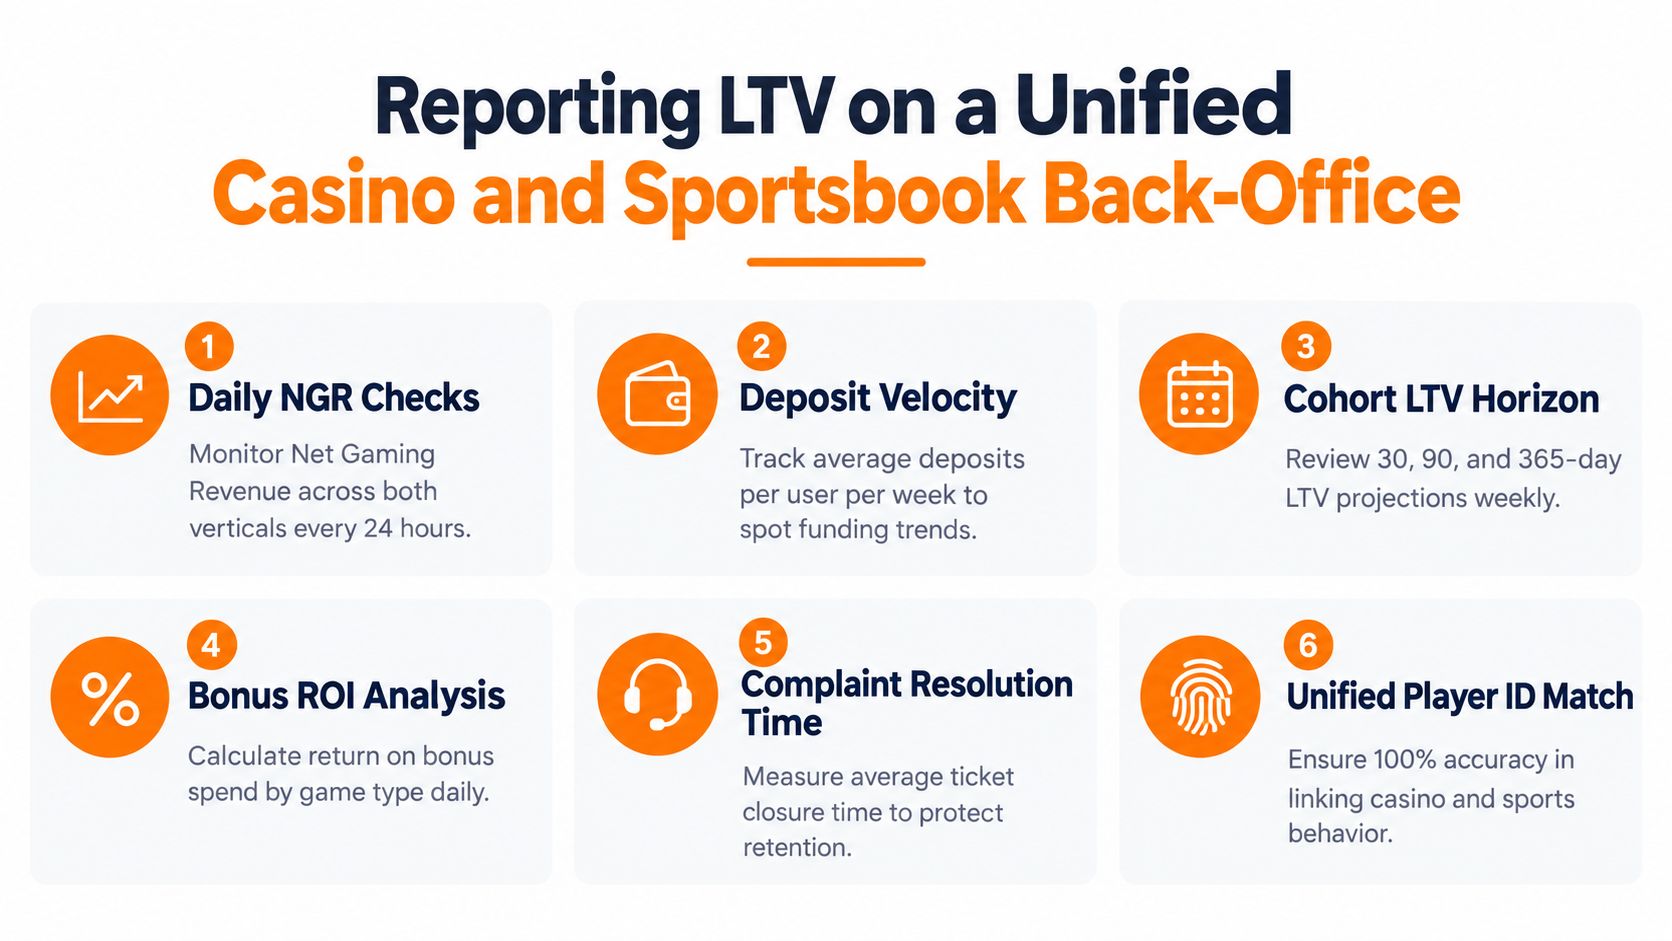
A player fails KYC, waits for a withdrawal, or receives a safer-gambling intervention. Each event can change the relationship's future value. A unified back office should expose those operational moments alongside wallet balance, wager history, and KYC status, while keeping casino and sportsbook economics distinct. Shared player identity connects the journey, but reporting must preserve differences in margin, settlement, bonus cost, payment behavior, and risk.
The daily operating view should show changes that require action:
- Net gaming revenue by product and market.
- Deposits, withdrawals, reversals, and the withdrawal queue.
- Payment failures and unresolved cashier events.
- KYC submissions, approvals, retries, and escalations.
- High-value activity and safer-gambling interventions.
A weekly commercial view should compare mature-enough cohorts with their CAC and commission boundary. Review cumulative net contribution by acquisition source, first-deposit month, jurisdiction, device, product mix, and bonus exposure. The output should support a decision: scale, constrain, redesign, or intervene.
Set a cadence that matches the decision
Daily: Operations checks wallet movements, NGR, deposits, withdrawal queues, failed payments, and urgent KYC or risk states.
Weekly: Acquisition, finance, CRM, payments, and compliance review cohort LTV against CAC targets, bonus ROI, high-value player movement, and payment-failure patterns.
Monthly: Analytics recalibrates churn curves, compares recent cohorts with historical ones, and checks whether market, product, or regulatory changes have altered contribution.
Quarterly: Predictive models are retrained or tested against actual outcomes. Remove features that no longer predict activity, then compare forecasts with realized horizon LTV.
Keep the source systems reconciled
The wallet ledger remains the financial source of truth. The bonus engine records promotional cost and conversion status. KYC and compliance systems explain verification state and regulatory friction. CRM adds campaign exposure, lifecycle state, and support or re-engagement history.
A unified operating layer can bring casino, sportsbook, payments, player accounts, KYC/AML workflows, bonuses, loyalty, affiliate tracking, and reporting into one environment. For broader context, see this overview of what iGaming operations require. The value for LTV analysis comes from reconciling product activity, wallet events, bonus drag, and player state before teams act on the number.
Use this weekly checklist:
- Cohort LTV delta: Which cohorts changed since the prior review?
- High-value movement: Which players entered, exited, or changed VIP or risk state?
- Bonus ROI: Which offers generated contribution after effective bonus cost?
- Payment failures: Which methods or markets are creating avoidable abandonment?
- KYC friction: Where are retries or escalations clustering?
- Support outcomes: Which contact reasons correlate with reduced activity?
Building an LTV Practice Operators Can Actually Defend
The phrase “average player LTV” is often a warning sign. Revenue distributions are skewed, and a blended average can make a losing segment look acceptable because a small high-value group offsets it. Guidance for iGaming operators places average customer lifetimes around 18 to 30 months for businesses with positive unit economics and 6 to 12 months for operators with negative economics, as outlined in this player acquisition guide. Those ranges are directional context, not a substitute for your own cohort data.
A defensible practice separates the dimensions that change net contribution:
- Acquisition source: Affiliate, paid search, brand, partnership, or other channel.
- Jurisdiction: Tax, affordability, deposit, and compliance requirements affect economics.
- Device and payment mix: Experience and processing costs vary across player journeys.
- KYC tier and status: Verification friction can change whether the relationship progresses.
- Bonus exposure: Promotional cost can erase apparent gross value.
- Product behavior: Casino-only, sportsbook-only, and cross-product players can have different contribution paths.
| Segment | Blended LTV (€) | Segment LTV (€) | Delta vs Average |
|---|---|---|---|
| All players | 100 | 100 | 0 |
| Paid acquisition cohort | 100 | 70 | -30 |
| Affiliate cohort | 100 | 125 | +25 |
| Cross-product cohort | 100 | 145 | +45 |
The table is an illustration of how segmentation should be presented, not a report of observed operator performance. Replace the example values with reconciled net contribution from your own back office, then compare each segment with its actual acquisition and retention cost.
The next action is concrete: create a 30-day cohort LTV report segmented by acquisition channel, compare each segment with CAC and affiliate caps, and direct retention spend toward the cohorts that demonstrate viable net contribution. Revisit the report on a fixed cadence, and don't allow a blended average to hide a channel that loses money.
NexGrate provides a white-label casino and sportsbook platform with unified wallets, payments, KYC and compliance workflows, bonus and loyalty tools, affiliate tracking, and back-office reporting. Use that shared operating layer to connect player lifetime value with the moments that shape it, then visit NexGrate to discuss your launch or platform migration.